
The language of computational thinking is now commonly used to characterize the process through which learners break down problems, represent data, use algorithms, test models, debug procedures, and employ abstraction in disciplinary contexts. The modern formulation of computational thinking was born out of computing [1]. Efforts then followed to translate the idea into practices appropriate for use in schools [2]. Further reviews defined its importance for K-12 education [3]. Curricular discussions in other parts of the world expanded computational thinking beyond computing alone [4]. Discipline-specific frameworks have additionally framed the practice in terms of mathematics and scientific inquiry. However, the instructional value of computational thinking lies not just in access to programming tools. Instructors need not simply give computational practices away; rather, the value comes with their application to discipline-specific explanations, comparisons, and solution improvement [5]. The integration of computational practices and disciplinary goals determines the instructional value of computational thinking [6]. As such, more is required from teachers than brief demonstrations of the technology or practice. They need professional learning that links computational thinking to curricula, instruction, assessment, and classrooms.
Professional development research reveals why this linking is difficult. More content- and sustainment-oriented professional learning has greater impacts on teaching [7]. Teacher learning arises from situated professional activities, rather than isolated exposure [8]. Coherence with the work of teachers and opportunities for collective participation are also crucial [9]. Active learning is another crucial element of professional development [10]. Evaluation of professional development should go beyond participation and satisfaction [11]. Later reviews stress that teachers interpret new ideas through their subject matter and professional experiences [12]. School routines and available resources influence whether the new practices are implemented [13]. The link between professional development and instruction requires more explicit analysis [14]. This is even more true for computational thinking. Teachers may need to learn the tool, understand the computational concept, design an activity, predict student misconceptions, and figure out what learning evidence looks like. Even a technically successful workshop could fail to determine whether teachers are capable of implementing computational thinking in instruction.
Research on computational thinking in education has brought clarity to both its conceptualization and assessment. Early reviews of literature described computational thinking in terms of programming, abstraction, and problem solving [15]. Reviews came later to conceptualize the idea in educational contexts broadly [16]. Assessment-focused research identified decomposition, algorithmic thinking, debugging, and related cognitive processes [17]. Systematic review evidence has linked these processes to multiple forms of assessment [18]. Other reviews have also focused on how computational thinking is practiced at different educational levels and in various disciplines [19]. The literature on assessment indicates that some instruments prioritize cognitive ability [20]. Other instruments put more emphasis on task performance and artifacts produced by students. The research on teachers has highlighted the importance of pedagogical capability [21]. Technological, pedagogical, and content knowledge is crucial in how computational tasks are designed for instruction [22]. Discipline-based integration is more important than tool operation alone [23]. Finally, teachers should understand how computational ideas fit into existing disciplinary practices [24]. These contributions provide a strong background for research on computational thinking professional development, but reveal a synthesis challenge: positive reactions, enhanced confidence, applied tasks, classroom transfer, and student learning are not all the same kind of evidence.
This study tackles the synthesis challenge. Professional development research may allow one to make the claim of acceptability when teachers report positive reactions. The claim about teacher learning will be supported by demonstration of content knowledge or applied skills. The claim about classroom transfer will be supported only when teachers have evidence of being able to transfer the learning to instruction. The claim about student impacts will be supported only when student outcomes are measured in the context of computational-thinking goals of professional development. The term “computational thinking integration” could thus mean different kinds of evidence. A review record that includes many studies may not provide adequate support for the strongest claims if the studies are short, focused on the tool, conference-oriented, and based on teacher self-report assessment.
The systematic review by Liu et al. [25] provides the corpus of 76 studies reviewed in this paper: 4,600 gross search records, 3,203 unique records, 242 screened full texts, and 76 coded studies. The corpus also provides counts for publication form, explicit computational-thinking goals, pedagogical focus, tool focus, integration orientation, program duration, support features, and assessment endpoints. These values allow one to make the claim calibration since they indicate how far the literature on computational thinking professional development goes in terms of moving from teacher exposure towards classroom enactment and student-level evidence.
The guiding research question is: What level of transfer claim is warranted by the 76-study professional-development corpus, and where do the retained counts limit claims about classroom integration and student impact? The question provides a specific focus to the study. Instead of asking whether computational-thinking professional development is generally successful, it aims to find out which claims are supported, which should be avoided, and which numerical patterns justify these recommendations. The corpus is the aggregate evidence provided in the systematic review of computational thinking professional development for K-12 classroom integration [25]. The calculations include Sequential Readiness Mapping, Corpus Compression Audit, Focus-Coupling Ledger, Temporal Exposure Contrast, and Endpoint-Proximity Gradient. The conclusions are made based on these calculations rather than an overview of the innovation.
The corpus consists of aggregate evidence collected in the systematic review of computational thinking professional development for K-12 classroom integration [25]. The retained counts include search and screening, publication form, focus categories, duration categories, integration-support features, and assessment endpoints. The record contains 4,600 gross search records, 3,203 unique records after duplicates are removed, 242 screened full texts, and 76 coded studies. The coded corpus includes 28 journal articles, 46 conference papers, and 2 book chapters. The corpus also includes counts for explicit computational-thinking goals, pedagogical focus, tool-only focus, integration-oriented studies, duration categories, and endpoint categories. The analysis remains within the scope of these 76 studies and their aggregate counts without introducing individual participant records, raw effect sizes, classroom observations, or additional empirical samples.
The orientation of the analysis is transfer assurance. The more transfer assurance that is provided by a study, the more explicitly it mentions computational thinking goals, relates them to pedagogy, supports practice and enactment of teachers, has sufficient duration for classroom uptake, and moves endpoints from teacher- to classroom- and student-levels. The analysis does not judge individual studies. Rather, it interprets the 76-study corpus as a field-level claim structure, checking which claims are best supported, which should be avoided, and what numerical patterns justify these recommendations.
Sequential Readiness Mapping (SRM) arranges the retained evidence across four layers. The retrieval layer checks how the search record is narrowed to evidence. The goal layer examines whether computational thinking is explicitly stated and connected to pedagogy. The support layer checks whether professional development supports practice and enactment of teachers: hands-on practice, sufficient duration, mentorship, community support, feedback, reflection, and pedagogical support are considered. The evaluation layer checks whether endpoints stay teacher- or move to classroom- and student-levels. The Sequential Readiness Mapping is retained as an ordering framework to prevent the review record from being treated as a flat set of features.
A Computational Thinking Transfer-Assurance Panel (CTTAP) combines the retained evidence values and calculated indicators. Corpus compression measures the selectivity of the review record. Focus coupling measures the relationship between computational thinking goals, pedagogy, tools, and integration. Temporal exposure describes the balance between short and sustained professional development formats. Endpoint proximity describes the distance between the assessment record and classroom or student-level transfer. Table 1 summarizes the retained evidence values and calculated indicators.
| Assurance block | Retained variables | Calculated indicators |
|---|---|---|
| Corpus compression | 4,600 gross records; 3,203 unique records; 242 full texts; 76 coded studies; 28 journal articles; 46 conference papers; 2 book chapters | Duplicate pressure; gross-to-coded yield; unique-to-coded yield; full-text screening rate; full-text acceptance rate; publication-channel shares |
| Focus coupling | 45 explicit computational-thinking goals; 40 explicit CT goals with pedagogy; 31 without explicit CT goal; 56 pedagogical focus; 15 tool-only focus; 11 CT–pedagogy–tool focus; 38 integration-oriented studies | Explicit-goal share; pedagogy share; full-coupling share; CT-goal-to-pedagogy coupling; integration-to-full-coupling contrast; tool-only burden |
| Temporal exposure | 34 programs of five days or less; 7 full-school-year or multi-year programs; 35 intermediate or other durations | Short-program share; sustained-program share; short-to-sustained contrast; duration-share difference |
| Endpoint proximity | 28 reaction; 15 attitude; 39 perception; 27 content knowledge; 38 skill/application; 11 student impact | Weighted endpoint-proximity mean; teacher-report load; student-impact study share; student-to-integration ratio |
The table above shows the limits of the paper. All results come from one of four retained blocks from the 76-study corpus. It is relevant because the paper operates within the confines of the existing coded corpus and examines if the counts in the corpus are enough for more and more robust transfer.
The Corpus Compression Audit (CCA) measures the extent to which the search landscape compresses into coded evidence. Let \(N_g\), \(N_u\), \(N_f\), and \(N_c\) represent gross records, unique records after duplication removal, full texts screened, and coded studies, respectively. Duplicate pressure was measured as
Gross-to-coded and unique-to-coded yields were calculated as
The full-text screening rate and full-text acceptance rate were calculated as
Publication-channel share for category \(k\) was calculated as
CCA is relevant because a broad initial search return can give the appearance of a mature evidence base while the transfer-relevant coded corpus may be much smaller.
The Focus-Coupling Ledger (FCL) determines whether CT objectives are connected to pedagogy and tools. Here, let \(N_{CT}\) be the number of articles that have CT objectives, \(N_P\) articles that have pedagogy objective, \(N_A\) articles that have all three CT-pedagogy-tool objectives, and \(N_I\) articles that
Because the record includes 40 studies in which explicit computational-thinking goals were paired with pedagogical focus, CT-to-pedagogy coupling was calculated as
The difference between integration orientation and full focus coupling was calculated as
FCL makes the distinction between a broader approach to integration and a more powerful one in which all three dimensions – computational thinking objectives, pedagogical intentions, and technology use – can be observed.
The Temporal Exposure Contrast (TEC) is based on the comparison of brief and sustained professional development experience. If \(N_s\) stands for five-day-or-less programs and \(N_l\) stands for school-year- and multiple-year programs, then
The short-to-sustained contrast was calculated as
and the duration-share difference was calculated as
TEC is related to professional-development research due to the repeated correlation of duration and instruction change [7]. The coherence between the professional development programme and the teachers’ practice is also an important element [9]. Active learning increases the possibility of influence on professional development practice [10]. It is necessary to take into account the process by which the programme will change instruction [14]. Follow-up and implementation support are particularly important for scaling professional learning [26].
The Endpoint-Proximity Gradient (EPG) evaluates how close is the assessment record to the classroom transfer. Six endpoint categories were selected based on the coded endpoint record: teacher reaction, teacher attitude, teacher perception, content knowledge, skill/application, and student impact. Ordered proximity weights used were 0.20, 0.40, 0.40, 0.60, 0.80, and 1.00. These are weights that show how far the endpoint is from the classroom and student-level transfer. They are simple ordering values without any scale of measurement. The weighted endpoint proximity mean is:
Teacher-report load was calculated as
student-impact study share as
and the student-to-integration ratio as
The EPG analysis does not make the assumption that all student impact measures are equally powerful. Its purpose is to indicate whether the endpoint distribution continues to be teacher-facing or shifts towards evidence of transfer at the level of classroom and students.
The SRM analysis reveals an active yet inconsistent track record of professional development. At the retrieval layer, the search scope is broad while the coded corpus related to transfer is quite modest. At the goal layer, pedagogy is a frequent theme while explicit computational-thinking learning objectives are typical for the majority of works; however, complete consistency between computational thinking, pedagogy, and tools used is unusual. At the support layer, the track record mentions hands-on practice, time, mentorship, community involvement, feedback, reflection, and pedagogical support. At the evaluation layer, there is plenty of activity beyond mere reaction but student impact is still very rare compared to the teacher-facing endpoint. The pattern indicates that the literature has shifted beyond awareness-building while the strongest transfer claims are still limited by coupling, duration, and proximity of endpoints.
The four-layer evidence stack is revisited after the integrated diagnosis where the numeric results can be interpreted as a claim-calibration sequence.
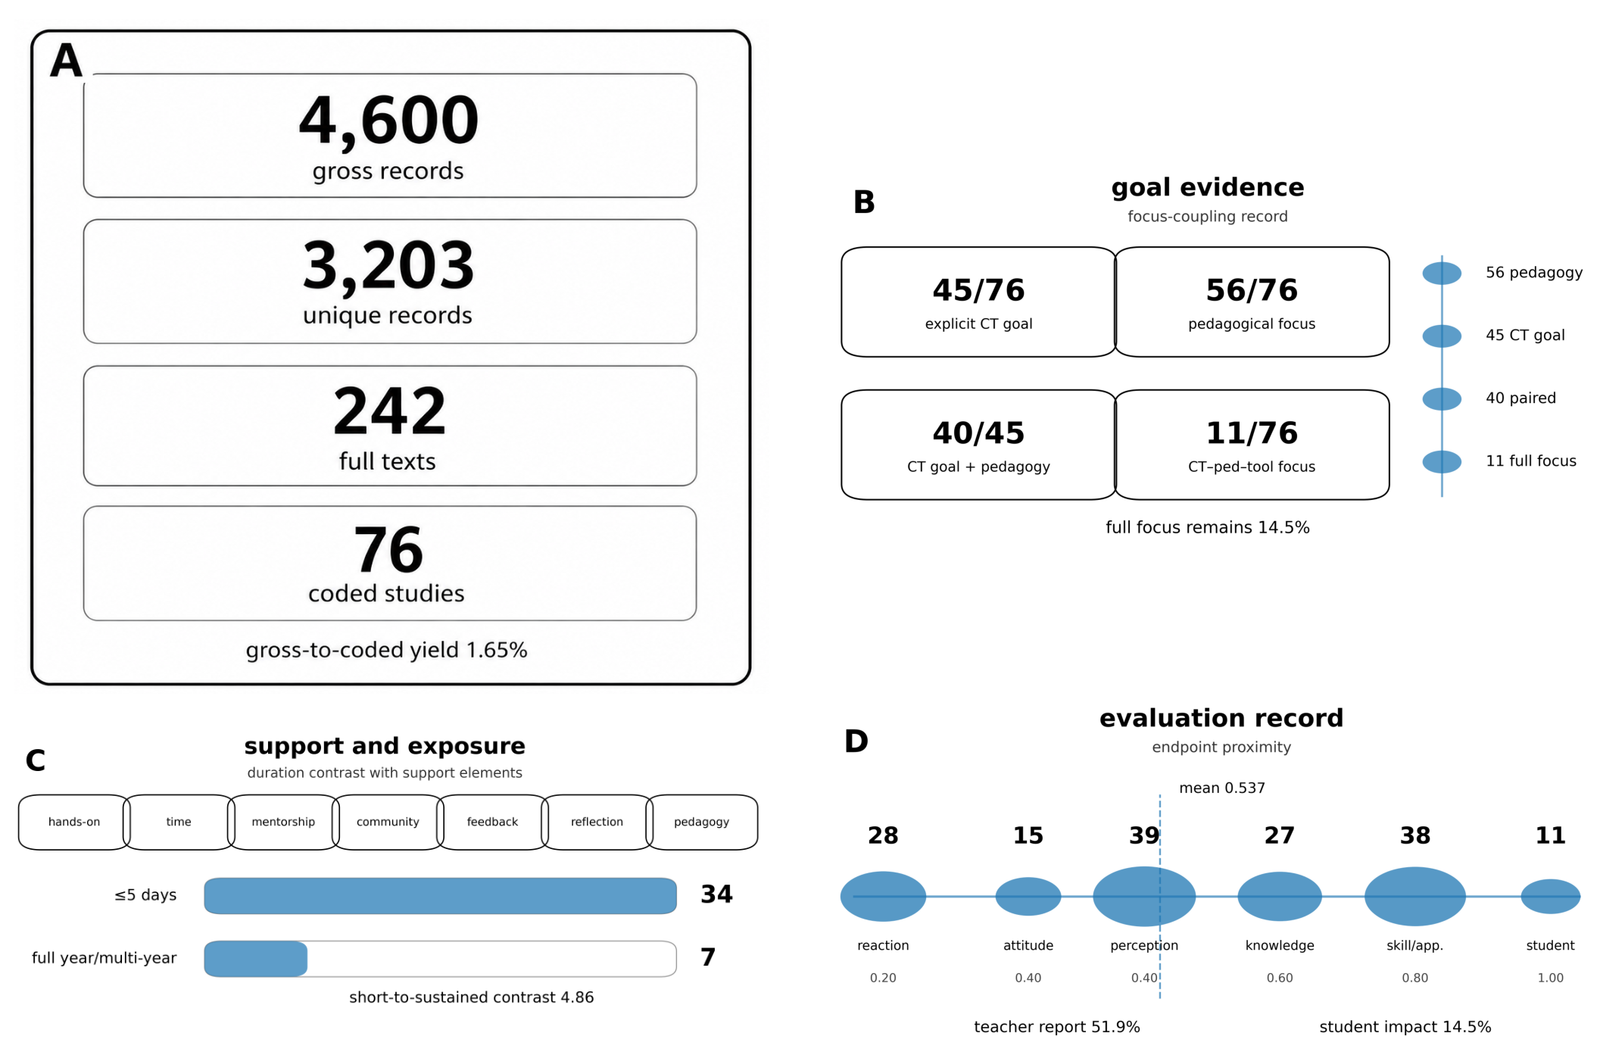
The results of the Corpus Compression Audit show that the compression from search retrieval to coded evidence is strong. The search yielded 4,600 gross records while the number of unique records after duplicates elimination was 3,203, which means duplicate pressure is 30.4%. Only 242 full texts, i.e., 7.56% of unique records, made it to full-text screening. The final coded corpus included 76 studies, which yields 1.65% yield gross and 2.37% yield unique. The full-text acceptance rate is 31.4% which suggests that many articles passed full-text review but failed to reach the coding boundary. The calculated indicators are reported in Table 2.
| CCA descriptor | Value | Transfer-assurance interpretation |
|---|---|---|
| Gross search records | 4,600 | Broad initial retrieval landscape before screening and duplicate removal. |
| Unique records after duplicate removal | 3,203 | Candidate evidence base available for title, abstract, and full-text decisions. |
| Full texts screened | 242 | Only 7.56% of unique records reached full-text assessment. |
| Coded studies | 76 | Final corpus equals 1.65% of gross records and 2.37% of unique records. |
| Duplicate pressure | 30.4% | Search vocabulary captured overlapping evidence channels and repeated records. |
| Full-text acceptance rate | 31.4% | A substantial share of full texts still failed the coding boundary. |
| Journal article share | 36.8% | Journal evidence is important but not dominant in the retained corpus. |
| Conference proceeding share | 60.5% | The evidence base is strongly shaped by conference dissemination. |
| Book chapter share | 2.6% | Book chapters form a minor component of the retained corpus. |
The compression table impacts how the field size needs to be interpreted. A search of 4,600 records would seem indicative of widespread activity, but it is the 76-study coded corpus that forms the available evidence for transfer. Additionally, the conference share suggests rapid communication through computing and educational technology channels in a field. This is good for reporting innovation, but less helpful for long-cycle claims without classroom enactment or learner results.
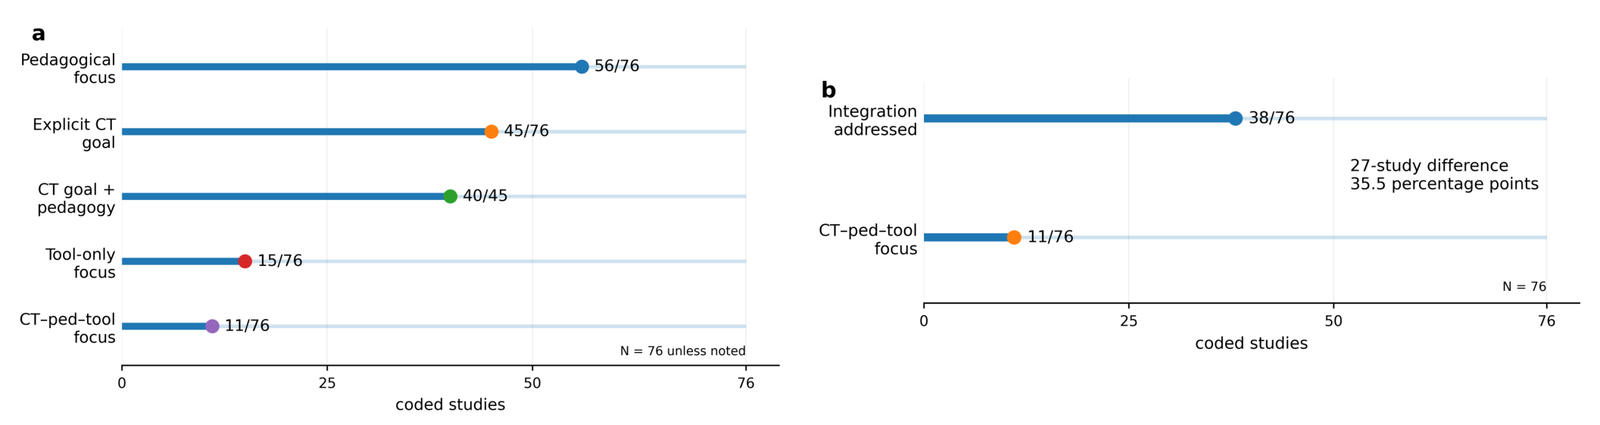
The FCL results display a strong signal for pedagogy, but low complete coupling. The goal of computational thinking was stated in 45 of the 76 studies, 59.2%. The remaining 31 studies, 40.8%, did not have the explicit computational-thinking goal stated. Pedagogical focus was evident in 56 studies, 73.7%. Out of the 45 studies with the explicit computational-thinking goal, 40 also had a pedagogical focus. This led to a CT to pedagogy coupling rate of 88.9%, which is a strong result since it shows that when the goal is named, it is also linked to pedagogy. Table 3 displays the FCL results.
| FCL descriptor | Value | Transfer-assurance interpretation |
|---|---|---|
| Explicit computational-thinking goal | 45 of 76 (59.2%) | Computational thinking was directly named in a majority of professional-development goals. |
| No explicit computational- thinking goal | 31 of 76 (40.8%) | A large minority implied computational thinking without stating it as an instructional goal. |
| Pedagogical focus | 56 of 76 (73.7%) | Teaching and curriculum orientation were common across the corpus. |
| Explicit CT goal with pedagogical focus | 40 of 45 (88.9%) | Explicit CT goals were usually attached to pedagogical aims. |
| Tool-only focus | 15 of 76 (19.7%) | One-fifth of the corpus concentrated on tools without broader focus coupling. |
| CT–pedagogy–tool focus | 11 of 76 (14.5%) | Fully coupled designs were present but rare. |
| Professional development addressing integration | 38 of 76 (50.0%) | Integration appears in half of the corpus. |
| Integration-to-full-coupling contrast | 35.5 percentage points | Integration orientation was much more frequent than complete CT–pedagogy–tool coupling. |
Focus table solves an essential aspect of the research problem. There was no presence of field focused on stand-alone technical training, since pedagogical focus is prevalent, and CT to pedagogical coupling is very high in explicit-goal cases. The limitation lies in a more strict requirement of total coupling – there were only 11 studies with all three foci – computational thinking, pedagogical, and tool.
Figure 1 shows that integration language is not to be overstated. While 38 studies dealt with integration, 11 did achieve the full CT–pedagogy–tool focus coupling. The 35.5 percentage-point difference means that an article could well be considered integration-focused without having specified all three instructional connections: the connection between the computational target, pedagogical target, and tool of choice.
The TEC analysis reveals a strong disparity between the short-form and sustained-form professional development. Five-day or shorter professional development programs were included in 34 out of 76 analyzed studies, or 44.7%. Full school year or multiple-year programs were represented by only 7 articles, or 9.2%. The ratio of short-form to sustained-form is 4.86, which means that the former type of program is mentioned almost five times more often than the latter. The difference in shares of durations is 35.5 percentage points. The 35 studies, which represent 46.1% of the total, fall into intermediate and other duration categories, see Table 4 for details.
| TEC descriptor | Value | Transfer-assurance interpretation |
|---|---|---|
| Programs lasting five days or less | 34 of 76 (44.7%) | Short formats are common and can support exposure, orientation, or initial skill development. |
| Intermediate or other duration | 35 of 76 (46.1%) | Nearly half the corpus sits between brief exposure and clearly sustained professional learning. |
| Full-school-year or multi-year programs | 7 of 76 (9.2%) | Explicitly sustained exposure is uncommon. |
| Short-to-sustained contrast | 4.86 | Short programs appear nearly five times as often as sustained programs. |
| Duration-share difference | 35.5 percentage points | The duration record is weighted away from long-cycle enactment support. |
The timing table does not mean that short programs have no merit. Short sessions may provide computational thinking terminology, tools, and simple lessons. The transfer limit occurs where short time frames are applied to make assertions beyond those that are sustainable. Only 7 extended programs could be seen; thus, the data supports teachers’ first acquisition better than long-term classroom implementation.
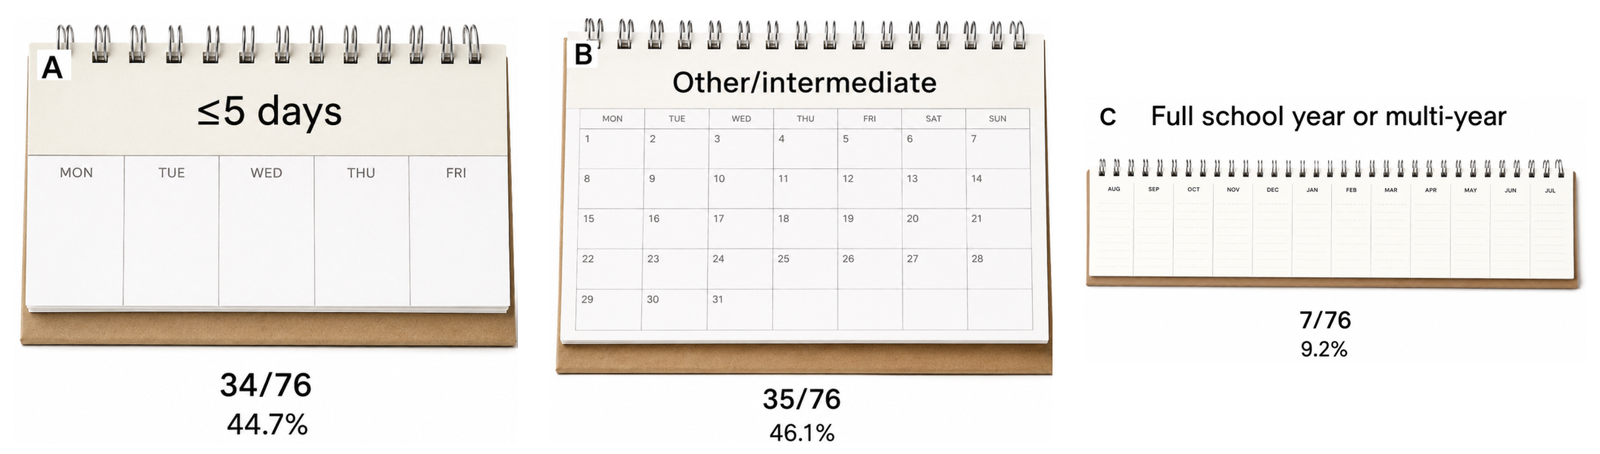
The three calendar panels shown in Figure 2 clearly indicate the skewness of duration. Short and intermediate/other category represent 69 articles, whereas full-school-year or multi-year formats account for 7 articles. Hence, the record of professional development is based on introductory or bounded experiences. It is therefore imperative that any claim regarding classroom changes requires follow-up evidence rather than a professional development event only.
| Endpoint category | Count | Weight | Transfer-assurance interpretation |
|---|---|---|---|
| Teacher reaction | 28 | 0.20 | Least proximal; supports claims about acceptability or satisfaction. |
| Teacher attitude | 15 | 0.40 | Indicates orientation or disposition toward computational thinking. |
| Teacher perception | 39 | 0.40 | Common teacher-facing endpoint; useful but not evidence of enactment. |
| Content knowledge | 27 | 0.60 | Shows movement toward teacher understanding of computational-thinking content. |
| Skill/application | 38 | 0.80 | Stronger teacher-learning endpoint because it involves applied capacity. |
| Student impact | 11 | 1.00 | Most proximal endpoint, but present in only 14.5% of coded studies. |
| Weighted endpoint-proximity mean | 0.537 | – | The endpoint record sits between teacher perception and applied teacher learning. |
| Teacher-report load | 51.9% | – | Teacher-facing reports dominate the endpoint mentions. |
| Student-to-integration ratio | 28.9% | – | Student-impact evidence appears in less than one-third of integration-oriented studies. |
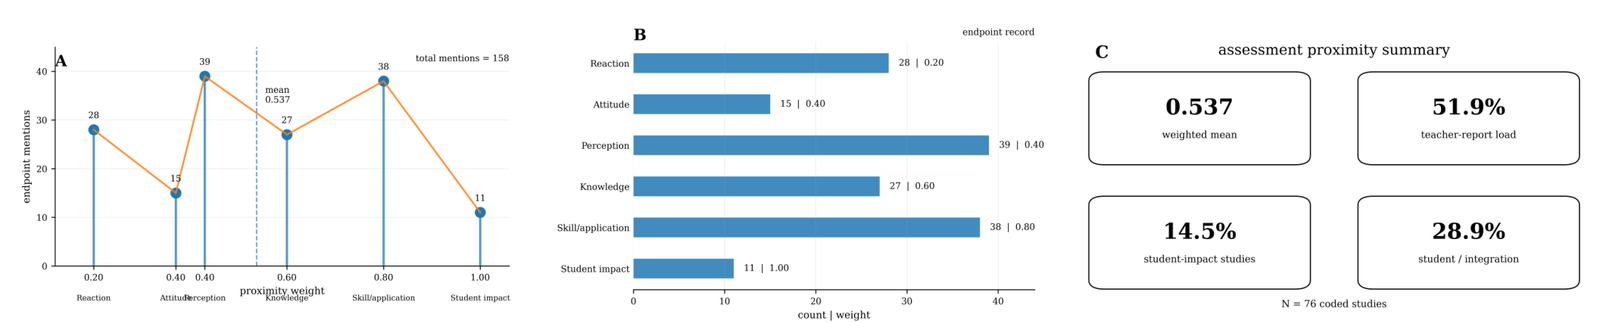
The endpoint record indicates that the assessment in most cases extended beyond reaction but were predominantly teacher oriented. Reaction to assessment occurred in 28 endpoints, teacher attitude in 15, teacher perception in 39, content knowledge in 27, skill/application in 38, and student impact in 11 cases. Since endpoint categories may be overlapping, the numbers represent endpoint mentions rather than study categories. The proportion of teacher report was 51.9% as reaction, attitude and perception altogether accounted for slightly above half of all endpoint mentions. Student impact occurred in 11 out of 76 studies which implies student impact study share of 14.5%. The weighted endpoint proximity mean was 0.537. The endpoint distribution is summarized in Table 5.
The endpoint table is critical in providing the solution to this paper since it indicates what the evidence can support. While the evidence does not only include satisfaction because content knowledge and application skills recur often, the endpoint proximity mean score of 0.537 and teacher report load of 51.9% indicate that the pattern is still teacher-centered.
The panels for the endpoint proximity in Figure 3 reveal why the finding requires qualification. Skill/Application is the largest endpoint group, which justifies making statements on teacher capacity. Impact on students, meanwhile, is still the smallest high-proximity group. In other words, the record gives strong support to teacher learning statements, some support to classroom transfer statements, and only weak support to student impact statements if student measures are included.
The integration of the diagnosis combines sequential layers and the computed indicators. Strongest indications come from the existence of a 76-study coded collection, high pedagogical focus share, the 88.9% CT-to-pedagogy coupling in explicit-goal papers, and 38 mentions of skill/application endpoint. Limitations of the finding are the 1.65% gross-to-coded yield ratio, 60.5% conference proceedings proportion, 14.5% full focus-coupling proportion, 9.2% sustained duration proportion, 51.9% teacher report proportion, and 14.5% student-impact study proportion. Table 6 presents the claim diagnosis results.
| Evidence layer | Main numerical result | Claim implication |
|---|---|---|
| Corpus formation | 76 coded studies from 4,600 gross records | The usable transfer-relevant corpus is much smaller than the search landscape. |
| Publication form | 60.5% conference proceedings; 36.8% journal articles | The field shows rapid dissemination, but long-form evidence is not dominant. |
| Goal and pedagogy | 45 explicit CT goals; 56 pedagogical focus; 40 of 45 paired | Teacher-learning and pedagogical claims are supported more strongly than tool-only claims. |
| Complete focus coupling | 11 of 76 studies | Fully aligned CT–pedagogy–tool designs are uncommon. |
| Duration | 34 short programs; 7 sustained programs | Short exposure dominates over long-cycle enactment support. |
| Endpoint proximity | Mean 0.537; teacher-report load 51.9%; student impact 14.5% of studies | Assessment supports teacher-facing and applied teacher-learning claims more strongly than student-outcome claims. |
In the above table, it can be seen that none of the values leads to the conclusion made in the paper. In terms of compression, publication format, focus coupling, time, and end point, everything is leading to one boundary of claim. Professional development portfolio is active and pedagogical, but the publication evidence is not configured for making such claims by default.
The claim ledger shown in Figure 4 translates the numeric code into a guideline for generating conclusions. More assertive claims have to be associated with the 76 study-based account, focus learning linkage, focus-learning application link, and skill and application knowledge. Careful language has to be used in making claims that rely on full focus coupling, long duration, impact on learners, and other than teacher reported outcome measures.
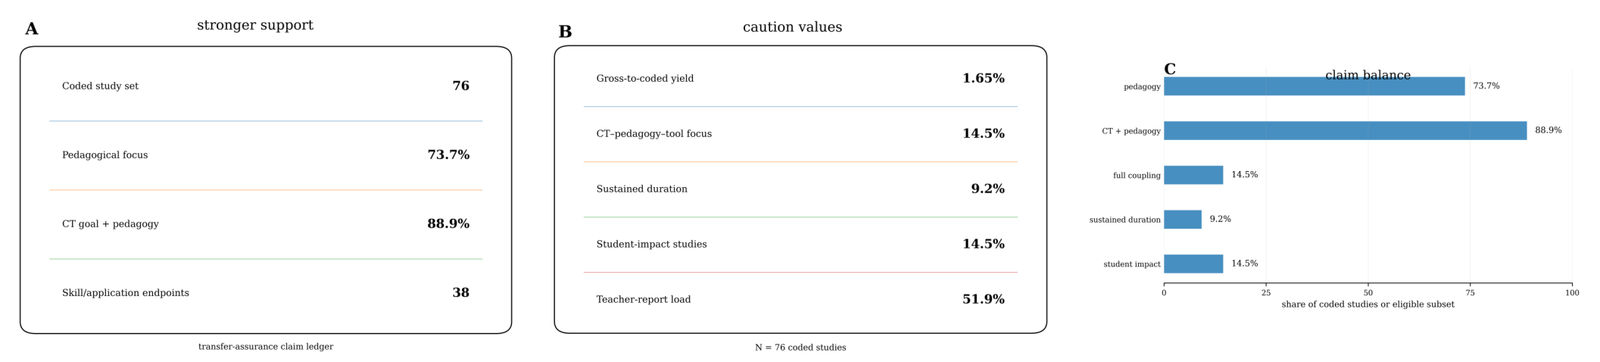
The evidence stack in Figure 5 summarizes the results sequence after the individual indicators have been considered. This record begins with 4,600 gross records but ends with 76 coded studies; it shows significant goal and pedagogical signals but only 11 coupled studies; it includes known supportive elements but only 7 sustained programs; and it has a 0.537 mean weighted endpoint-proximity score rather than student-oriented distribution. Therefore, the four layers confirm the same conclusion: the evidence base is strong enough for claims of teacher learning but not deep enough for unfounded claims of student impact.
The results indicate a lively, pedagogically informed, and still inconsistent literature of professional development regarding computational thinking. This analysis provides a clearer interpretation of the success of computational-thinking professional development than simply claiming its general success. First of all, the 76-study record confirms the presence of extensive design and teacher-learning efforts. However, it also indicates places of weakening of the claims. The compression evidence narrows the evidence set from 4,600 gross records down to 76 coded studies. The focus evidence shows the presence of broad pedagogy but not complete CT–pedagogy–tool coupling. Duration evidence reveals prevalence of short and intermediate formats in the record. Endpoint evidence shows the prevalence of teacher-focused measures over student-impact ones.
Those findings agree with the professional development literature in general. Learning research for teachers consistently shows that instructional changes require more than just new ideas [8]. The effective professional development should possess elements that would allow making those changes [10]. Teachers interpret new approaches in their professional context and based on their experience [12]. It should thus be explicitly established how professional learning leads to instruction change [14]. The content focus is an important condition for its transfer to classroom practice [7]. Coherence with teachers’ practice allows them to make this connection [9]. Sustained follow-up support is particularly important in order to sustain and scale implementation of innovations [26]. The current evidence record indicates the importance of those conditions for computational thinking. Teachers are not just implementing a tool but trying to integrate computational thinking with discipline-specific sense-making and student artifacts. It could be fine to use a short workshop to orient teachers, but it alone cannot ensure that teachers will implement lessons, adapt tasks for students, and assess student computational thinking.
The focus-coupling result is promising but at the same time revealing. Pedagogical focus appears in 73.7% of all studies, and explicit computational thinking goals are coupled with pedagogy in 88.9% of all studies with explicit goals. It thus shows that the field has already largely progressed beyond treatment of computational thinking as a purely technical addition. At the same time, only 14.5% of all studies demonstrate CT–pedagogical–tool focus coupling. It is a significant result since the integration of computational thinking usually requires all three elements. Computational goal without pedagogical pathway becomes abstract. Tool without explicit computational goal becomes activity. Pedagogy without tool affordances is hard to apply to computational tasks.
The endpoint result makes the biggest contribution to the claim calibration. Teacher reaction, attitude, and perception measures are valuable since professional development needs acceptance, confidence, and perceived relevance. Measures of content knowledge and skill/application show that teachers have learned something useful for their practice. However, the measure of student impact appears in only 11 studies. It does not mean that the others are poor but means that their conclusions should correspond to their endpoints. It is not a good idea to interpret a study with the measure of teacher perception as a measure of student learning. A study of applied teacher skill can serve as evidence for teacher capacity claims but also needs classroom/student evidence for the transfer claims.
Endpoints in Figure 6 place the conclusion at the boundary of teacher learning and student impact. The mean endpoint-proximity of 0.537 places the record outside simple reaction and below student-impact evidence distributions. A ratio of students’ to integration endpoints of 28.9% implies that even among studies with a focus on integration, student-impact evidence is present in less than one-third of studies. That is why the paper’s answer stresses the importance of claims about teacher-learning support in contrast to wide claims of student-level transfer.

The form of publication is also an important factor. Conference proceedings can play an important role in computing education because of their ability to disseminate innovative tools and instructional designs. Thus, a conference-focused record is not a shortcoming. Its meaning is limited: the field might be publishing innovations faster than reporting on long-term, multi-endpoint evidences. Journal publications and reports might complement the former with detailed instrument, process, and outcome descriptions. Thus, the claim-calibration approach not only shields early-stage studies from dismissal but also prevents stretching evidence of the early stage beyond its capabilities.
The practical implication of the paper is that professional development for computational thinking should correlate its claims with its evidence. Programs designed to raise initial awareness should include reaction, confidence, and conceptual learning evidences. Classroom-integration programs should incorporate lesson artifacts, records of implementation, teacher artifacts, classroom observations, or enactment evidences. Programs claiming student benefit should include student-facing evidences such as computational-think tasks, debugging explanation, models, programs, simulations, computational notebooks, and rubric-scored design artifacts. The key condition is not in including evidences for all the endpoints in each study. The condition is in matching the claim with the endpoint.
The interpretation remains within the aggregate 76-study record. The analysis does not re-assess the quality of individual studies, country distribution, grade levels, disciplinary domains, tool types, and effect sizes. Endpoint categories might overlap across different studies, and therefore, endpoint values are interpreted as mentions, not as mutually exclusive numbers of studies. Ordered endpoint weights are clear claim-distance measures, not psychometric scales. None of those limitations weakens the answer of the paper because the observed values are significant and consistent: 1.65% gross-to-coded yield, 14.5% complete focus coupling, 9.2% sustained duration, 51.9% teacher-report load, and 14.5% student-impact studies all indicate the same conclusion about the claim strength.
The research question asked what claim of transfer level is justified by the 76-study professional-development corpus and how the retained counts limit the claims about classroom integration and student impact. The answer is precise: the corpus most strongly supports claims about teacher exposure, pedagogical attention, conceptual learning, and applied teacher capacity. It justifies classroom-transfer claims only in cases of alignment of the study evidence with the computational-thinking goal, pedagogical approach, tools used, duration, and classroom enactment support. It justifies student-impact claims only in the small fraction of the corpus where student-facing evidence is reported.
The numerical justification of this answer is consistent throughout the analysis. The coded corpus contains 76 studies out of 4,600 gross records, resulting in gross-to-coded yield of 1.65%. The proportion of the conference proceedings in retained studies is 60.5%. Pedagogical focus is present in 73.7% of studies. Computational-thinking goals are explicitly paired with pedagogy in 88.9% of the studies, but complete coupling of CT-pedagogy-tool focus is found in only 14.5% of the corpus. Programs lasting five days or less are 4.86 times as common as full-school-year and multi-year programs. The endpoint record reaches weighted proximity mean of 0.537, the proportion of teacher-report endpoints in endpoint mentions is 51.9%, and the proportion of student impact is 14.5%.
The conclusion of the paper is not the general statement about the effectiveness or ineffectiveness of computational-thinking professional development. The paper proves that evidence base is most strong for teacher-learning claims and weakest for unqualified student-impact claims. In order for the field to make stronger transfer claims, future studies have to make visible the computational-thinking goal, connect it with pedagogy and tools, provide sufficient support for classroom enactment, and assess outcomes on the same level as the claim. This answer is direct consequence of the paper’s research question and values of the 76-study corpus.