
Lab work in chemistry education becomes really useful for students when they start understanding how a measurement can be used as proof. It is possible to find many students able to record a color, detect a spectral signature, calculate yield, and even repeat a procedure. However, it is harder to ask a student to judge whether these data can be used as the basis for any claims. Copper nanoparticle syntheses become especially useful for this purpose since the product is not characterized only by its elemental nature. It can be soluble ions, oxidized particles, aggregated particles, a mixture of phases, or metallic nanoparticles. Therefore, a high copper recovery does not guarantee the presence of metallic copper nanoparticles and the absorption feature does not say anything about yield, phase purity, and stability of the material. Such an approach defines the learning challenge of the undergraduate copper nanoparticle laboratory – how to interpret which claim is supported by each measurement and how confidence changes when evidence streams agree partially.
The reason why copper nanoparticles are appropriate for this learning problem is that the material characteristics are quite informative yet vulnerable. Copper metal nanoparticles possess localized surface plasmon resonance at visible wavelengths [1]. This optical property depends on particle size and shape, as well as on the dielectric environment, interparticle distance, and surface chemistry [2]. As compared to silver and gold, copper is relatively cheap [3] and it is widely used for catalysis, electronics, sensing, antimicrobial properties, and conductive inks [4]. At the same time, copper is very prone to oxidation during synthesis, washing, storage, or analysis [5]. The vulnerability of copper makes this property very important for the future application of copper nanoparticles [6]. Some studies of chemical reduction have shown the influence of solvent and surfactant on the nanoparticle size and optical behavior [7]. The reducing agent and pH influence the nanoparticle formation and stability [8]. The atmospheric environment is an additional factor of control of copper nanoparticle preservation [9]. This information shows that the interpretation of copper nanoparticle experiment should include more factors than one single interesting feature.
Optical properties have the particular importance since the plasmonic response is usually the first evidence of the metallic nanoparticle formation. In the well-preserved copper nanoparticles, the strong plasmonic band in the visible region is informative, especially in the case of agreement of particle size and diffraction measurements with nanoscale metallic copper [10]. However, plasmonic evidence is not always present in useful cases. The oxidation reduces metallic character. The aggregation smears and broadens the spectral band [11]. The surface chemistry changes the dielectric environment, while particle size variation increases the optical envelope [12]. This weakened or broadened optical response is more informative than clean one since students should choose between several possibilities: the presence of metallic copper nanoparticles, a copper-containing material, or partially preserved nanomaterial.
Copper–ammonia colorimetry provides other types of evidence. The reported value of calibration slope equal to 42.7 M\(^{-1}\) cm\(^{-1}\) with \(R^2 = 0.999\) means that the relationship is highly linear for the calculation of copper amount after complexation [10]. It is a good way of estimation of copper recovery, but this measurement is not related to the pre-complexation state of the material. After the conversion of the sample to the complex, this measurement proves the presence of certain amount of copper, but it does not inform whether it was metallic or oxidized, aggregated or pure. This idea shows an important feature of analytical chemistry: a reliable number can prove one statement and be the weak evidence for the second one. It is also true for percent yield: the yield is a measure of recovered amount, but not the identity and quality of nanomaterial.
Structural evidence gives the third type of information. The record of particle size of 15.4 \(\pm\) 3.4 nm with the diffraction peaks assigned to the face-centered cubic copper support the metallic nanoparticle assumption for the strongest record [10]. The electron microscopy and X-ray diffraction measurements are not redundant with UV–visible spectroscopy. The microscopy describes morphology and size distribution in the observed area, while the diffraction gives the crystalline phase-sensitive information. Together with the optical response and recovery, these measurements give a possibility to write informative conclusion neither overstated, nor imprecise. The educational value lies in the fact that each method answers its own question: the spectroscopy asks about the optical behavior consistent with the metallic nanoparticles; the colorimetry asks about the amount of copper; the diffraction asks about the presence of crystalline metallic copper; and the synthesis condition about the protection of chemistry from the oxidation.
Research on the laboratory learning supports the shift from procedural completeness to evidence-based judgment. It is possible to see that students interpret lab work in terms of task completion, not conceptual interpretation [13]. The expectations about the achievement of the right results or acceptable report increase such a tendency [14]. The successful laboratory instruction should include clear structures that relate the observation to the reliability of measurement [15]. It also should connect the uncertainty with scientific argumentation [16]. The pre-laboratory and in-laboratory supports can help the students to prepare to the reasoning required by complex chemical systems [17]. The argument-driven inquiry methodology also underlines that students learn from the claims, the choice of evidence, and the reasoning connecting them [18]. The record of copper nanoparticles used here provides the good context for this practice since there are differences in temperature, argon protection, copper recovery, and optical identity of three samples.
The research question is: which material-identity claims are warranted for three undergraduate copper nanoparticle records when copper recovery, plasmonic behavior, structural evidence, and preparation condition are interpreted together, not separately? The question is different from the question of success of synthesis since it asks about the possibility to use each sample for the classification of high-confidence metallic copper nanoparticle, the classification of copper presence with the weak metallic identity, or the qualified divergence classification due to the disagreement of recovery and optical identity. The calculation, evidence-strength labels, replicate checks, anonymous card classification, and discordance audit organize the reported copper nanoparticle values without changing synthesis, spectroscopy, colorimetry, particle size, and diffraction observations. The key contribution is the materials-chemistry interpretation of evidence.
The analysis is based on the copper nanoparticle laboratory record used for undergraduate physical chemistry education [10]. The laboratory experience involves copper nanoparticle synthesis, UV–visible spectroscopy of nanoparticle suspensions, copper–ammonia colorimetry for copper quantification, particle-size determination, X-ray diffraction, and the copper–ammonia complex discussion. The numerical record involves a pronounced optical maximum around 590 nm for the most stable compound, an average particle diameter of 15.4 \(\pm\) 3.4 nm, peaks in X-ray diffraction at approximately 43.35\(^\circ\), 50.49\(^\circ\), 74.20\(^\circ\), and 89.98\(^\circ\), and a copper–ammonia calibration slope of 42.7 M\(^{-1}\) cm\(^{-1}\) with \(R^2=0.999\) [10]. Three records serve as the comparative basis: Sample 1 was synthesized at 220 \(^\circ\)C with argon shielding and gave 18.4 mM copper with a 28.0% yield; Sample 2 was synthesized at 180 \(^\circ\)C without argon shielding and gave 9.0 mM copper with a 13.5% yield; Sample 3 was synthesized at 220 \(^\circ\)C with argon shielding and gave 15.8 mM copper with a 23.5% yield. Optical performance distinguishes the records: Sample 1 gives a pronounced plasmonic maximum around 590 nm, Sample 2 lacks plasmonic activity associated with copper nanoparticles, and Sample 3 exhibits weakened plasmonic activity.
The evidence streams are allocated into four categories. Reaction plausibility involves temperature and atmosphere. Optical identity involves the localized surface plasmon resonance. Recovery involves copper concentration and percent yield. Structural support involves the particle size and X-ray diffraction data when they are available. Such categories prevent any measurement from carrying the load that it is unable to bear. Copper–ammonia concentration is strong evidence for the recovered copper upon complexation but not direct evidence for the metallic nanoparticle identity. On the contrary, the plasmonic response is better linked to the metallic copper nanoparticles although being still prone to aggregation, oxidation, and dispersion state effects. The particle-size and X-ray diffraction records enhance the identification claim if they agree with the optical signature. The following calculation utilizes such distinctions but does not change the experimental protocol.
The data in Table 1 confirms the chemical contrast that informs the interpretation. Sample 1 and Sample 3 have identical temperatures and atmospheres, but they do not behave optically alike, hence preparation cannot determine material composition on its own. Sample 2 has the most unfavorable condition and also the lowest recovery value, but what is more important than just being unfavorable is the fact that there is no plasmonic activity, which means that any presence of copper must be excluded from nanoparticles.
| Record | Condition | Optical evidence | Cu concentration | Yield |
|---|---|---|---|---|
| Sample 1 | 220 \(^{\circ}\)C, argon protection | Strong maximum near 590 nm | 18.4 mM | 28.0% |
| Sample 2 | 180 \(^{\circ}\)C, no argon protection | Plasmonic behavior absent | 9.0 mM | 13.5% |
| Sample 3 | 220 \(^{\circ}\)C, argon protection | Weakened and broadened response | 15.8 mM | 23.5% |
The concordance calculation ascribes interpretive meaning to the records, while keeping the experimental order intact. The recovery index, \(R_i\), scales the copper concentration and yield of the records according to the maximum concentration and maximum yield of the three-record set:
where \(C_i\) is copper concentration in mM and \(Y_i\) is percent yield. The optical identity score, \(O_i\), is taken from the plasmonic signature: 1.00 for a good clear copper nanoparticle signature, 0.00 for an absence of a copper nanoparticle signature, and 0.55 for a diminished or broadened signature. The separation between recovery and identity is then \(D_i=R_i-O_i\). Values larger than zero indicate that more copper is recovered than supported by the optical evidence. Categorical interpretation is based on the relationship between \(R_i\), \(O_i\), condition, and structural evidence.
Evidence domains are labelled strong, conditional, or weak. Strong evidence labels mean that the evidence supports the claim and is internally consistent. Conditional evidence labels mean that the observation is chemically relevant but insufficient on its own to make a decision about the material-identity claim. Weak evidence labels mean that the evidence is either absent, ambiguous, or contrary to the stronger identity claim. Measurement guidance stresses that uncertainty statements should have to do with the use of the measurement rather than being a mathematical technicality [19]. Agreement literature cautions that numerical proximity is not necessarily synonymous with interpretive agreement [20]. The reliability must be considered relative to both the format of the evidence and the interpretation [21]. In order to understand agreement, the purpose of the comparison needs to be specified [22].
Replicate checks continue to be part of the same interpretation process. Students take chosen absorbance measurements after the copper–ammonia stabilization period and re-measure the nanoparticles suspensions spectrum after gentle re-distribution of the sample when time is available on the instrument. Colorimetric measurement variability leads to discussions of incomplete complexation, timing, transfer losses, or instrumental noise. Nanoparticle spectrum variability leads to discussion of settling, aggregation, oxidation upon manipulation, or uneven sampling. Replicates are used to help with careful interpretation and not for the development of a separate validation study.
Blind classification by anonymous cards helps to reduce expectations-driven interpretations. Students first classify the records on the basis of optical and recovery evidence and then reveal the preparation condition. Students then decide whether the condition strengthens, weakens, or does not change the identity claim. A written explanation of any disagreement between the recovery, the optical behavior, and the structure is required as a discordance audit. The audit calls for students to state the disagreement, come up with chemically plausible explanations for the difference, and say what further evidence would help to reduce the uncertainty. The activity follows the claim-evidence-reasoning practices used in undergraduate laboratory courses [18]. The assignment also conforms report writing to evidence-centered science communication [23].
The three specimen records are shown separately in Figure 1. The figure combines the preparation condition, spectral behavior, copper recovery, nanoscale evidence, and final classification into a concise record.
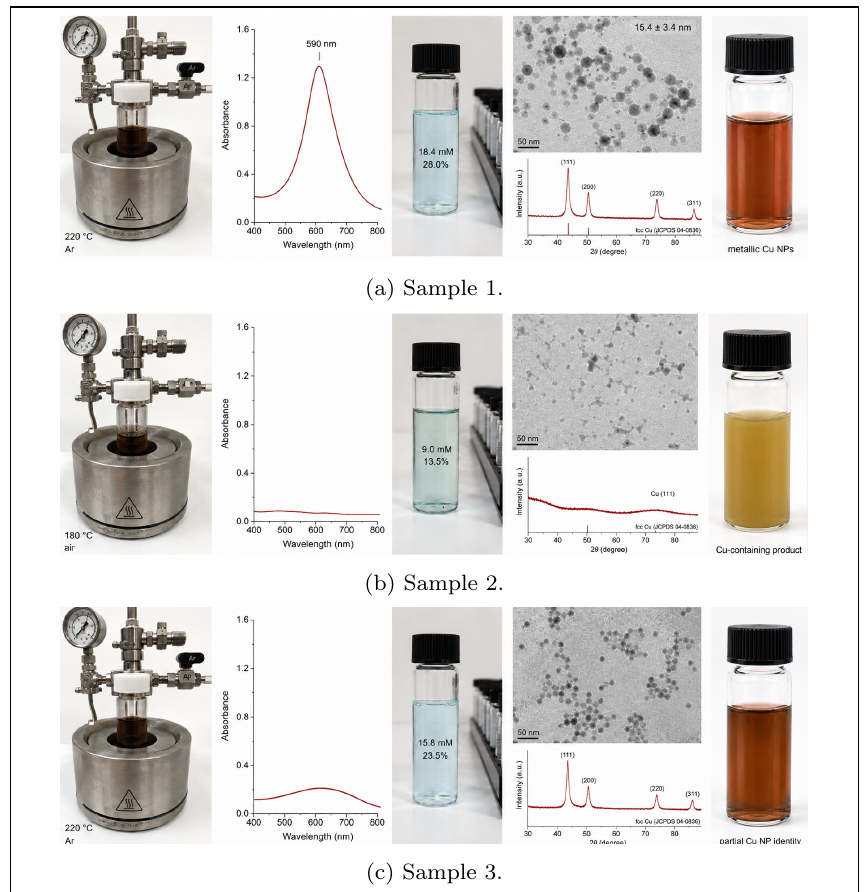
The three-panel record lends itself to a graded, not binary, interpretation. Sample 1 exhibits positive condition, high optical response, maximum recovery, and structural support; Sample 2 features low optical support together with low recovery; Sample 3 retains considerable recovery, but loses spectral definition. Visual inspection demonstrates why the research question cannot be addressed in terms of the detection of copper.
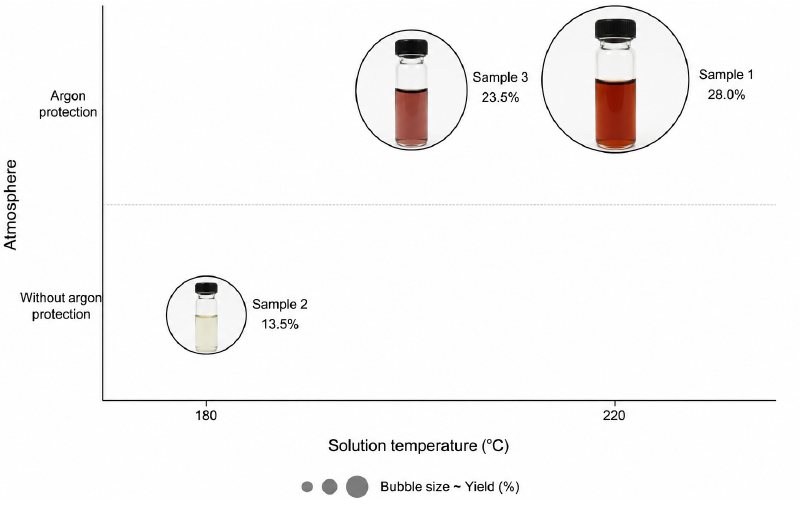
The temperature–atmosphere field, shown in Figure 2, helps to understand an important chemical aspect: despite being in the same 220 \(^\circ\)C argon-protected area, Samples 1 and 3 are not comparable. Yield-scaled markers reveal that the former is still strong, but it has different optical condition from Sample 1. Condition contributes to chemical plausibility but cannot replace identity evidence directly.
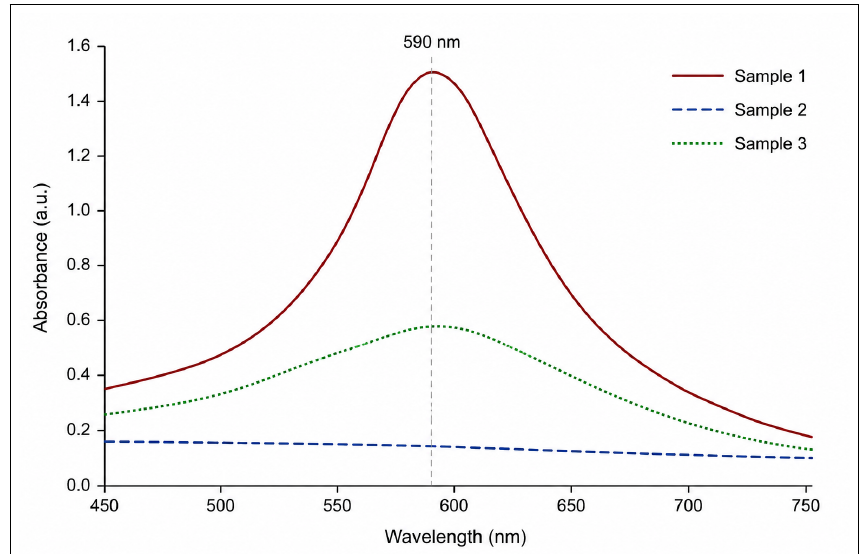
The optical difference between the three panels is evident from Figure 3. Sample 1 exhibits high optical response near 590 nm, Sample 2 is almost unresponsive in the same wavelength range, and Sample 3 shows broader, less sharp envelope.
The spectrum demonstrates that optical identity cannot be deduced based solely on the amount of copper present. The distinct 590 nm peak of Sample 1 confirms metallic copper nanoparticle behavior according to the available data regarding structure. The almost flat spectrum of Sample 2 renders a claim of metallic nanoparticle status implausible despite the fact that copper was found post-processing. Sample 3 presents the most instructive case since its spectrum reveals partial retention of metallic nanoparticle properties while not displaying optical identity similar to Sample 1.
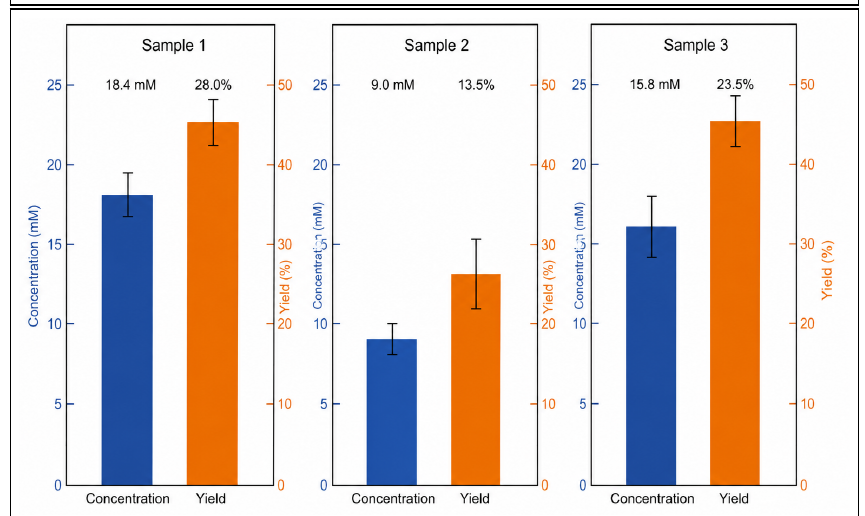
The recovery comparison illustrated in Figure 4 provides a quantitative rationale behind the separation of recovery and identity. Sample 3 obtains a maximum of 15.8 mM and 23.5%, putting it significantly closer to Sample 1 compared to Sample 2 with respect to the amount recovered. In the laboratory report using only recovery parameters, Sample 3 would be considered a near success. Its optical spectrum clarifies the reason why this judgment would be misleading: a large amount of copper does not imply metallic nanoparticle identity.
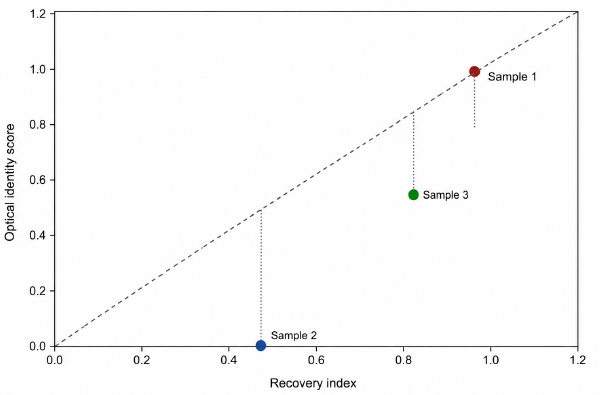
The values given in Table 2 represent the most clear-cut numerical response to the research question. In sample 1, there is no recovery–identity separation since both normalized recovery and optical identity are significant. In sample 2, the recovery–identity separation value is positive and quite significant, however, the separation comes from the absence of optical identity rather than from copper recovery. In sample 3, the separation value is lower, yet, it shows chemically more interesting picture: copper recovery is sufficient to demonstrate active metal chemistry whereas optical identity remains partial. This combination calls for a divergent claim rather than a successful one.
The plotted relationship shown in Figure 5 transforms the table into a visualization of the claim validity. Sample 1 is positioned in the region of agreement of recovery and identity. Sample 2 is positioned on the horizontal axis at the point of measurable recovery without optical identity support. Sample 3 is positioned below the equality line due to the fact that copper recovery in it is higher than optical evidence. The vertical separation in Sample 3 is the only instructional value for students in terms of the conclusion.
| Record | \(R_i\) | \(O_i\) | \(D_i\) | Interpretive result |
|---|---|---|---|---|
| Sample 1 | 1.000 | 1.00 | 0.000 | Recovery and optical identity are concordant |
| Sample 2 | 0.486 | 0.00 | 0.486 | Copper is present, but metallic nanoparticle evidence is weak |
| Sample 3 | 0.849 | 0.55 | 0.299 | Recovery exceeds optical identity support |
Sample 1 presents the most convincing material-identity claim. Reaction conditions are favorable, optical response is significant in the vicinity of 590 nm, copper recovery is maximum among all samples, and structural evidence supports nanoscale face-centered cubic copper. All these evidence streams do not merely present the same fact. They contribute to the different aspects of the claim: reaction condition proves the possibility, spectroscopy proves the optical behavior of metallic nanoparticles, colorimetry and yield prove the recovered amount, particle size proves the morphology, and diffraction proves the crystalline metallic copper.
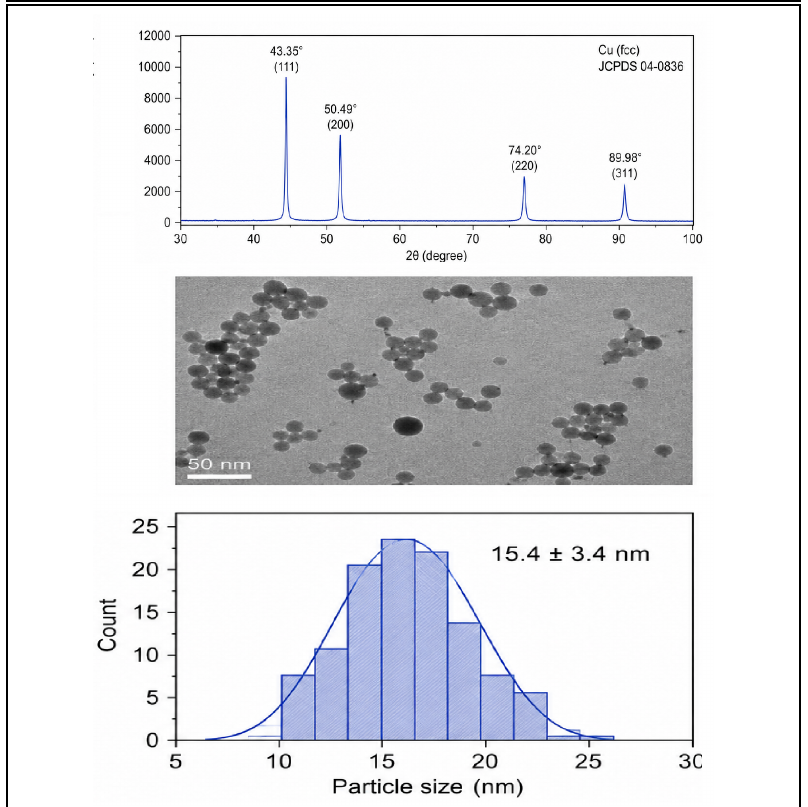
The structural evidence in Figure 6 accounts for why Sample 1 can be confidently described. The XRD data of the peaks at approximately 43.35\(^\circ\), 50.49\(^\circ\), 74.20\(^\circ\), and 89.98\(^\circ\) coincide with those of face-centered cubic copper, and the distribution of particle sizes centers around 15.4 \(\pm\) 3.4 nm. Interpreted together with the optical results, the identity claim is far more powerful than the claim based on the color of the precipitate and yield alone.
The condition of 180 \(^\circ\)C without argon atmosphere is less chemically plausible for copper nanoparticles, and the low recoveries of 9.0 mM and 13.5% are the lowest in the record. Importantly, there is no optical evidence of the characteristic plasmonic behavior. In addition to the conclusion of poor performance of the preparation, there is an important caveat, namely that there is some copper, but the evidence for nanoparticle identity is very weak. This nuance ensures that the students understand the difference between detection and identity of the analyte.
The most challenging interpretation comes with Sample 3. The condition looks favorable, and the recovery values of 15.8 mM and 23.5% confirm that there is a significant amount of copper. However, the optical signal is not clear and diffuse rather than sharp. There are several explanations for this result in terms of chemistry: oxidation, aggregation, larger distribution of the size, modifications in the surface states, or handling-induced dispersion loss. The calculation doesn’t impose a mechanism; it requires stating facts, uncertainties, and additional information needed for the clarification of the situation. The claim that follows is that Sample 3 indicates significant copper recovery with partial optical evidence of copper nanoparticle identity.
The classifications in Table 3 respond to the research question on the level of the samples. Sample 1 makes the highest material identity claim since the independent evidence streams confirm it. Sample 2 makes the claim of copper presence rather than a metallic nanoparticle one due to non-matching quantitative recovery with optical identification. Sample 3 makes the most qualified claim since the favorable reaction conditions and recovery are combined with only partial spectral evidence. This table replaces the success/failure narrative by material-evidence-ranked claims.
| Record | Classification | Evidence basis | Student conclusion |
|---|---|---|---|
| Sample 1 | High-confidence metallic Cu nanoparticle product | Favorable condition, strong plasmonic response, highest recovery, nanoscale size, fcc Cu diffraction | The record supports metallic copper nanoparticles with high confidence. |
| Sample 2 | Copper-containing product with weak metallic identity | No argon protection, absent plasmonic response, lowest recovery | The record supports copper presence but weak metallic nanoparticle identity. |
| Sample 3 | Recovery–identity divergence product | Favorable condition and substantial recovery, but weakened optical identity | The record supports partial metallic nanoparticle identity with unresolved optical loss. |
The key advantage in instruction is that disagreement becomes the result, not the problem. In a traditional laboratory report, Sample 3 would be considered as an awkward intermediate case. With this approach, it becomes a good test of whether students understand the concept of material identity. A student writing that Sample 3 was successful since its recovery yield was 23.5% would overgeneralize from the recovery evidence. Another writing that Sample 3 failed due to the weakening of the optical band would disregard the fact of copper recovery and favorable reaction condition. A defendable statement would need to combine both parts: the sample contains the recovered quantity of copper, but the optical evidence of the preservation of the metallic nanoparticle identity is incomplete.
The anonymous classification helps this discipline by forcing students to make an evidence-based claim without knowledge of reaction conditions. It is shown in Figure 7.
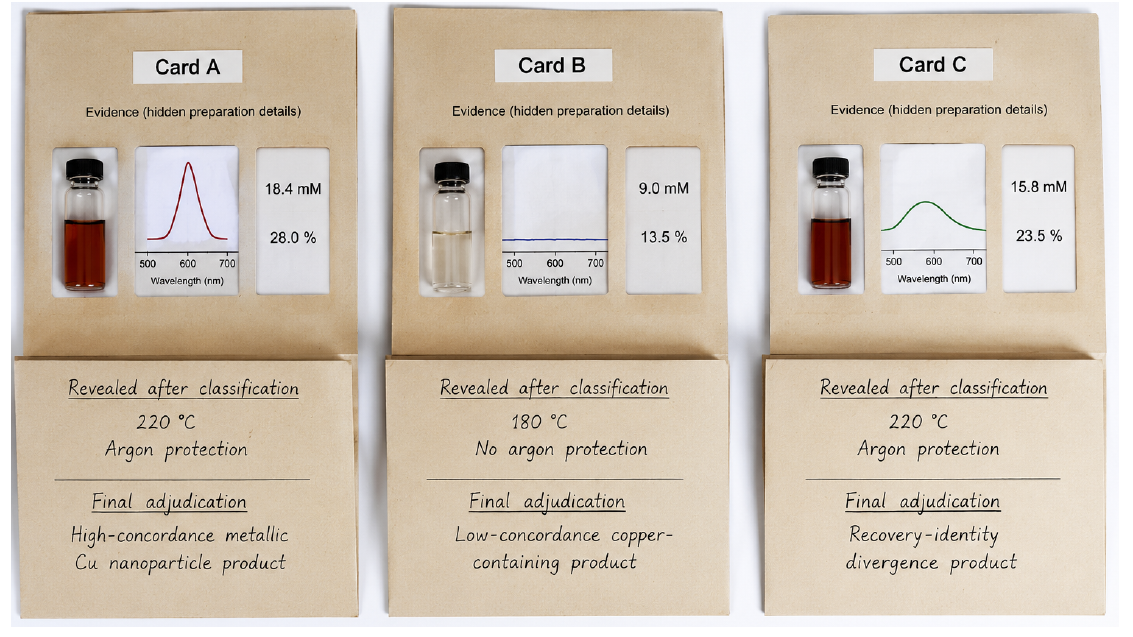
As seen in Figure 7, the card activity keeps the reaction condition from overpowering the initial decision. While a recording taken with argon gas at 220 \(^\circ\)C might seem to be a favorable chemical condition, as seen with Sample 3, having favorable conditions does not necessarily mean that there is an obvious optical identity. This card activity thus helps the students understand that they have to base their initial claim on the measurements and not the preparation process.
The interpretation products shown in Table 4 demonstrate how the same experiment could be used to evaluate reasoning quality via writing rather than extra lab work. Every product highlights one of the weaknesses typical for laboratory reports. Replicate note helps to address reliability of the measurement. Evidence labels help to avoid overclaiming. Blind paragraph helps to reduce expectation bias. Discordance audit helps to develop chemical explanations. Final adjudication requires a student to state precisely what does the record support. Thus, the assessment shifts from reporting of isolated results to defending material claim.
| Product | Required content | Learning function |
|---|---|---|
| Replicate note | Stability of repeated colorimetric or spectral readings | Makes measurement reliability visible |
| Evidence label sheet | Strong, conditional, or weak labels for condition, optical response, recovery, and structure | Prevents all observations from being treated as equally decisive |
| Blind classification paragraph | Initial material classification using anonymous records | Encourages measurement-first interpretation |
| Discordance audit | Explanation of conflicts among recovery, optical identity, and structure | Builds chemical reasoning under uncertainty |
| Final adjudication | Confidence-ranked material identity statement | Connects report writing to supported claims |
The three-record pattern makes clear the way Results and Discussion should be written. Rather than listing spectrum, yield, and diffraction as different observations, students can discuss each sample according to the claim it warrants. Sample 1 should be discussed as an agreement case. Sample 2 should be discussed as a copper presence/identity absence case. Sample 3 should be discussed as a divergence case. In such a way, students are encouraged to explain why the same measurement means different in different samples.
The literature background provides more support to this interpretation. Optical behavior of the metal nanoparticles is known to depend on morphology [1]. Besides, it also depends on the local environment and particle interaction [11]. The copper nanoparticle synthesis is sensitive to reducing conditions [5]. The surface protection influences the nanoparticle formation and preservation [7]. The atmospheric exposure may change the copper product obtained [4]. Other variables involved in synthesis may affect the nanoparticle stability and optical behavior [8]. The laboratory education research shows that students benefit from connecting measurement evidence to scientific claims rather than just completing a procedure [13]. The structured instruction can improve this kind of evidence-based reasoning [15]. The uncertainty consideration additionally improves the quality of laboratory interpretation [16]. The three-record copper set represents a combination of these two lines of literature: the chemical fragility becomes the reason for evidence-ranked conclusion, and the undergraduate result becomes the proof that students understand the difference between amount, identity, and confidence.
Accordingly, the language of the conclusion students are supposed to provide should be precise. For Sample 1, a defensible conclusion is that the record supports metallic copper nanoparticles with high confidence due to the convergence of the optical, quantitative, and structural evidence. For Sample 2, the defensible conclusion is that the record supports copper recovery, but there is a weak evidence for the metallic nanoparticle identity. For Sample 3, the defensible conclusion is that the record supports recovery with high confidence but only partial optical identity, making it a recovery–identity divergence record. All these conclusions directly answer the research question since they define the claim each record warrants.
The research question posed is which material-identity claims are warranted for the three undergraduate copper nanoparticle records interpreting together the copper recovery, plasmonic behavior, structural evidence, and preparation condition. The answer is sample-specific. Sample 1 warrants high-confidence metallic copper nanoparticle classification due to the favorable preparation, the strong optical maximum at 590 nm, the highest concentration/yield pair of 18.4 mM/28.0%, the nanoscale particle size of 15.4 \(\pm\) 3.4 nm, and face-centered cubic copper diffraction evidence. Sample 2 warrants the copper presence classification with the weak metallic nanoparticle support because it provides the measurable copper concentration at 9.0 mM and 13.5% yield but lacks the expected plasmonic behavior and was prepared without argon protection at 180 \(^\circ\)C. Sample 3 warrants the qualified recovery–identity divergence classification because it was prepared under favorable 220 \(^\circ\)C argon-protected conditions and retains substantial recovery at 15.8 mM and 23.5%, but has the weakened optical response.
This conclusion is not a general statement that copper nanoparticles were synthesized. It is an interpretation of the three records ranked by their ability to warrant a particular claim. The calculation reveals that recovery, optical identity, and structural evidence are not equivalent elements of evidence. The recovery values reveal the amount of copper present after the processing, the optical behavior is related to the metallic nanoparticle identity, and the diffraction/particle-size records confirm the phase and morphology when they agree with the spectrum. The Sample 3 is a crucial teaching case since it proves that the laboratory record could have the high quantitative significance and still require the careful material-identity claim.
The practical benefit for the undergraduate physical chemistry is that students learn to write conclusions as the evidence-ranked claims. They interpret the measurements in a precise way while keeping the same synthesis and characterization observations. The obtained laboratory report teaches that a defensible nanomaterial conclusion should state what is supported, what is only conditional, and why the disagreement among the evidence streams could be chemically significant.